Good morning! Today Troy continues about the investing for beginners series. You can check the previous posts about What are stocks and how to value them, How does Currency Trading Work, How are Currencies Traded, Investing in Commodities, What Fundamentals Affect Commodity Prices, What are ETF’s, What are Options, How are Options’ Prices Structured, Investing for Beginners Part 2 – Different Investment Strategies, When does Buy and Hold not Work, An Unconventional Approach to Buy and Hold, An Unconventional Approach to Buy and Hold Part 2, How the Investment Advisor Game is Played, An Introduction Into “Secular Investing”, Don’t Short When it Comes to Secular Investing, An Introduction into Trend Following
In the previous post, we talked about trend following and technical indicators. Technical indicators are used for trend following, and they’re also used for contrarian investing (which is another investment strategy that I will discuss in a future post). In this post, we’re going to focus on the technical indicators that are most commonly used for trend following.
Moving Averages
Probably the most common type of technical indicators, moving averages are the cornerstone of any trend following strategy. Like all investment names, the definition of a moving average is exactly what it sounds like – an average of the market price (which is always changing).
An X day moving average is created by adding the market’s close price over the past X days and diving that total by the number of days (X). For example, the most common type of moving average is the 200 day moving average (in trading lingo, we call that the 200 DMA). The 200 DMA is created by adding the market’s close price over the past 200 days and dividing that total by 200. The reason why this average “moves” is because as the days go by, we drop the earliest day in this time frame (e.g. 200 days ago) and add the most recent price (e.g. yesterday’s price).
The reason why moving averages are some important for trend following is that they smooth out the market’s price fluctuation. Thus, the moving average shows the market’s trend. And as you know, trends are the name of the game for trend followers!
Trend following is all about the relationship between a moving average and the market’s price.
- If the market price is going down, the X day moving average (e.g. 50 day moving average) will also fall. Bu because the moving average takes the average price over the past X number of days, the moving average will remain above the market price. Thus, both the price and the moving average are going down, but the price is below the moving average.
- The opposite is also true. If the market price is going up, the moving average will go up too. However, because the moving average takes the average price over the past X number of days, the moving average will remain below the market price.
Here is a picture of moving averages.
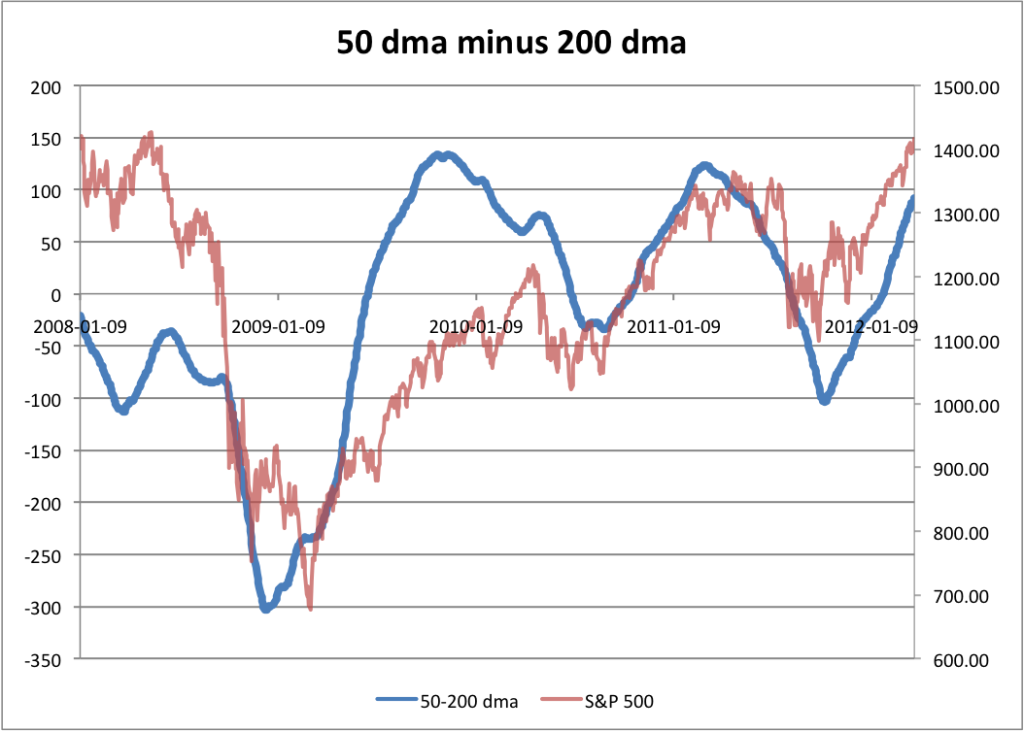
In the above graph, we have 2 different moving averages: the 50 DMA and the 200 DMA. As you can see, the shorter time frame moving average (in this case, the 50 DMA) sticks more closely to the price.
The prime use moving averages have for trend followers is that they wait for the price to cross the moving average. If the market price was rising but now it’s falling, that’s a bearish sign. But if the price falls below the moving average, then it’s a new bearish trend is starting.
The opposite is also true. Let’s assume that the market was falling. But now, the market starts rising, and it rises above the 200 day moving average. Thus, a typical trend follower will buy stocks because a new bullish trend has formed.
MACD
MACD (which is short form for Moving Average Convergence Divergence) is derived from moving averages. As I mentioned above, you can create any type of moving average you want. You can create a 5 day moving average, a 50 day moving average, a 200 day moving average, etc.
A MACD technical indicator always involves two moving averages: a short term time moving average and a longer time frame moving average. In this post, I’m going to use the 50 dma and the 200 dma as examples. The MACD is based on a simple tenet:
In a downtrend, the shorter time frame moving average (e.g. 50dma) should fall below the longer time frame moving average (e.g. 200dma). The opposite is true in an uptrend
This makes logical sense – the shorter time frame moving average more closely “hugs” the market price. What the MACD does it signal crossovers between the moving average. When the shorter time frame moving average rises above the longer time frame moving average, the MACD signals that a bullish trend has started and it’s time to buy. The opposite is also true.
Good intro on moving averages. One other point to bring up is that the moving averages can serve as price support or resistance. This often can give you a better signal of when to buy or sell than waiting for the MAs to cross.
The picture is showing as broken for me…
Derek @ MoneyAhoy recently posted…Book Review – Effortless Savings
Nice post on moving averages. When I was first getting into investing, I made it a point to learn these things and then studied them for a bit. Now I don’t have as much time to do analysis, so I’ve taken a more hands off approach when it comes to investing (automating things, investing in ETFs, etc.) But, knowing how the moving averages work and what they mean are important.
Jon @ Money Smart Guides recently posted…Types Of Short Term Investments
Very informative. I learned a lot now about technical indicators.. Thanks for sharing. 🙂
I have used all of the technical indicators you have discussed with varying degrees of success. They are, when used properly, great investment tools. One huge word of caution however. It is really, really easy to see what you want to see in a technical indicator rather than what it actually there. Many times I found myself anticipating a movement and thinking that it was actually starting while the reality was that nothing was happening. I was just impatient. Use care before you invest any sum of money at all.
Brad @ How To Save Money recently posted…How Much Money Can You Save Breastfeeding over Bottle Feeding?
That’s one of the most difficult things to keep in mind when trading based off of technical indicators – you have to wait for confirmation 🙂
Derek @ MoneyAhoy recently posted…How to Save Money on Your Fourth of July Party
I make sure I use technical indicators when I trade. If not, it is like driving with your eyes closed. And I used them together with stock chart patterns to increase my winning odds. Thanks for sharing a wonderful article on stock trading!
Eugene@ ShareInvestorMalaysia recently posted…Understanding Stock Chart Patterns
After spending far too much of my time understanding technical indicators and investigating various trading strategies based on various indicators and analyses, I failed to make any money.
Perhaps the indicators don’t work, perhaps I’m using them incorrectly, or perhaps I’m an idiot.
I know I learned a lot, but any sort of analysis is a GIGO situation. Given my experience, I am loathe to trust the data provided by companies and the stock market as a solid foundation for analysis of any stock.
Jack @ Enwealthen recently posted…Protect Your Money Online
When someone writes an article he/she keeps the idea of a user in his/her brain that how a user can know it.
Thus that’s wwhy thiss paragraph is amazing.
Thanks!
http://Newgrounds.Com recently posted…http://Newgrounds.Com
That’s an enlightening post for sure. I liked it thoroughly. When I first started trading in stocks this was the first thing I learned. Thanks for this informative post as these kinds of posts help people to learn so much on trading. I will like you to share more information on creating Resistance and Support charts using so many tactics including Fibonacci retracement ratios and trendlines. Thanks again.
nice thinking.
HOME
ABOUT US
CONTACT US
BOOK TITLES
MEDIA RESOURCES
E-BOOKS
UPCOMING EVENTS
AUTHOR NETWORK
AURA.ORG
ABOUT US
World Books Etc. is an independent publisher that offers a variety of platforms for our readers.
We currently publish books under three imprints:
1. Griot Series- Non-Fiction
2. Money Series- How-to
3. Hookah Hits- Fiction
The Griot Series displays the same entertaining, historical lyrics of the ancient African Griot storyteller.